Analisi Tecnica, Informazioni e novita' sul mondo del Trandig ON LINE, tantissimi link a bonus e consigli utili per apprendere Un fantastico lavoro che puoi fare comodamente dalla poltrona di casa tua.
The DAX is testing trend-line support from the June lows
Resistance remains clear around the 10800 mark, support below recent lows not so clear
In wait-and-see mode as market bobbles between support and resistance
As the day gets underway the DAX is ‘walking the line’, the trend-line dating back to ‘Brexit’. This comes after pulling off from staunch resistance surrounding the 10800 level. The trend-line isn’t the most important level of support, but if the market is to push on through to yearly highs it would be a good start for the market to hold here, or at the least not close below the 11/10 low at 10576. A close below support levels puts momentum in favor of shorts.
Resistance is easily identifiable as the market declines from the vicinity of 10800 for a fourth time. However, finding support levels, due to the enormous gap-n-rip following results of the US election, is not so easy should the DAX fail to hold the trend-line and recent daily lows. There isn’t substantial support until the trend-line rising up from June under the 10/10 low.
For now, as long as the market holds between short-term support in the 10610/576 region and resistance surrounding the 10800-level, trading will be choppy. Market conditions best left to quick-flipping day-traders. Price action wedging itself between rising support and horizontal resistance would be a welcomed development as pent up pressure would likely lead to a decent amount of momentum upon a breakout. But we will first need to be patient in waiting for this scenario to play itself out.
Traders with short-term hold times can use support and resistance as points of reference for shaping trades. In tomorrow"s webinar at 10 GMT we"ll talk in detail about how to handle current market conditions in the indices, as well as in the FX and commodity markets.
Yen falls Asian stocks rise, BOJ comes up empty in bond-buy operation
Aussie falls on soft jobs data, NZ Dollar gains on quake relief package
US Dollar may extend rally if Yellen endorses steeper rate hike outlook
TheJapanese Yenunderperformed in overnight trade as most Asian stocks advanced, sapping demand for the anti-risk currency. Japan’s benchmarkNikkei 225stock index gapped down at the trading open but trended higher through the session to finish the day nearly flat, with USD/JPY pacing the advance. Selling pressure may have been compounded after theBank ofJapanattracted no offers in its first fixed-rate bond buying operation.
TheAustralian Dollartraded lower after a disappointing set oflabor-market figures. The economy added a net 9.8k jobs in October, far fewer than the 16k projected by economists. Furthermore, September’s net job loss was revised to a whopping 29k from the initially reported 9.8k drawdown. The currency fell alongside front-end bond yields, suggesting the results nudged the priced-in RBA outlook toward the dovish side along of the policy spectrum.
TheNew Zealand Dollargained as the government said it set aside NZ$7.5 million in a business aid package for areas affected by this week’s earthquake.In a separate announcement,Finance Minister Bill Englishsaid preliminary estimates suggest the quake’s negative GDP impact of will be small. A parallel rise in US 2-year Treasury bond futures hints a bit of protective moderation in the US monetary outlook ahead of an upcoming speech formFed Chair Yellenmay have also helped the rates-sensitive currency.
The markets seem to have all but priced in a December rate hike, with Fed Funds futures implying the probability of an increase at 94 percent. This means that it will be comments about the policy trajectory thereafter that ought to be most market-moving. The expected tightening path hassteepened since the US presidential electionamid bets that President-elect Trump’s fiscal stimulus plans will be inflationary. TheUS Dollarmay extend its eight-day rally if Yellen appears to endorse such thinking.
To receive James Stanley’s Analysis directly via email, pleasesign up here.
Talking Points:
USD/CHFTechnical Strategy: Rampant USD-strength driving pair above resistance, towards 8-month highs and testing the 6+ month range.
Despite the fact that the U.S. Dollar is running up to 13-year highs, USD/CHF remains below 8-month highs; and this highlights the attractiveness of short USD/CHF in USD-weakness scenarios.
In our last article, we looked at the vigorous bounce off of support in USD/CHF on the night of the U.S. Presidential Election. After the pair had spent much of the prior six months in a range caught between .9500-.9950, this merely meant that the bullish side of the setup would likely be unapproachable while traders waited for resistance with the aim of trading the range back down towards support.
But since that last article, strength in the U.S. Dollar hasn’t calmed.The Dollar just set a fresh 13-year high earlier today, and in a world where most Central Banks are still ramping-up dovishness for their economies and currencies, continued gains in the Greenback can be seen until the Federal Reserve tempers this excitement of USD-strength. How that may happen, or when that may happen could be considerable guesswork, but traders should not expect that this Dollar strength is going unnoticed by the bank.
With the U.S. Dollar setting fresh 13-year highs, USD/CHF has merely rallied up towards resistance levels from March. This highlights the fact that while the Greenback has been rampantly strong, the Swiss Franc hasn’t beenas weakas many other currencies. This also highlights the fact that, should that USD strength subside, USD/CHF may be an operable area to look for that short-USD exposure.
Traders looking for short-USD exposure can continue to strategize around the bearish position while price action in USD/CHF remains subdued below the March high of 1.0092. Should this high get taken out, the technical picture gets considerably messier as the next swing-high is more than 150-pips higher on the chart.
Access Free Oil Trading Guide from DailyFX AnalystsHERE!
Talking Points:
Crude Oil Technical Strategy: Fibonacci Resistance Zone Expected to Resist Price Advance
EIA Stockpiles continue to build increasing concern if OPEC deal is not reached
Russian Energy Minister, Alexander Novak sees high chance of OPEC production cut accord
Wednesday’s price action in Crude Oil was dictated by ~a thirteen-minute window. At 10:30 am EST, The EIA inventory report showed that U.S. aggregate crude inventories rose 5.275M barrels that was far beyond the expected 1.5M. The rise in U.S. inventories was the third straight rise in U.S. inventories. Cushing, OK also experience a strong build in inventory.
On this news Crude Oil dropped toward $45/bbl until news came out about optimism from Russia of an OPEC accord. A strong turnaround at around 10:40 am EST on news that Russia’s Novak sees a high chance of an OPEC accord at the formal talks in Vienna at the end of November.
The optimism from Novak was enough to allow Oil to turnaround as it helped signal Russia’s willingness to go along with a production cut to help Saudi pass the deal and stabilize the market and price volatility.
We’ve long argued that the build in inventory in the U.S. could continue to act as motivation for OPEC to reach a deal to cut production. Currently, the market continues to get flooded with supply, and the current price levels with the supply glut would make it increasingly difficult for many sovereign states that depend on the Oil price to balance their budget.
Informal talks with OPEC members will also discuss what is needed to reach a deal in Doha on Nov. 17-18 that Russian Energy Minister Novak said he might also attend as Saudi works to find a solution with some member countries seeking exemptions.
D1Crude Oil Price Chart: USOIL Continues To Find Resistance At Fibonacci Retracement Zone
Chart Created by Tyler Yell, CMT Courtesy of TradingView
The Trendline drawn off the first higher low in early April should continue to be watched as an indicator for the path of least resistance in Oil that appears lower. Given the near-20% drop from the $51.94/bbl high and the sharp post-election pull-back, it’s hard to get excited about Crude’s prospects despite this week’s rally. Much of the spikes happen against a background that isnot supportive of higher Oil prices like a stronger US Dollarand multiple weeks of higher U.S. inventory stocks.
While the price of Oil is holding above the rising Trendline, much of the focus is on whether or not a worth-while accord can come from OPEC in Vienna later this month. The resistance as rumors continue to fly out as we head into the Nov. 17-18 meeting are the 38.2-61.8% Fibonacci retracement zone.
The zone occupies $45.90-$48.19/bbl. Within that price resistance zone is also the top of Andrew’s Pitchfork that should still be respected until price definitively uses the top channel as support for a move higher. The support zone worth watching is $43/42 per barrel. A break below this important zone that houses the post-election low and Trendline could indicate the risk of a double-top is upon us.
For what it’s worth, while we’ve discussed the strength of the USD, there is very little positive or negative correlation coefficients to Oil and other major markets. The lack of correlation helps show the market is ignoring Intermarket signals and focusing on the OPEC accord and whether or not it succeeds. If the OPEC accord does succeed, we’d look for a break and close above $48.19 to indicate a breakout and possible exit from the long-term bearish channel. However, a breakdown below the $43/42 zone would show traders with long Oil exposure could be in for a good deal of pain.
Key Levels Over the Next 48-hrs of Trading as of Wednesday, November 16, 2016
T.Y.
To receive Tyler’s analysis directly via email, pleaseSIGN UP HERE
Gold Prices Are Attempting to Claw Back From Support
To receive James Stanley’s Analysis directly via email, pleasesign up here.
Talking Points:
Gold Technical Strategy: Longer-term bullish case exists > $1,200; near-term has been aggressively bearish.
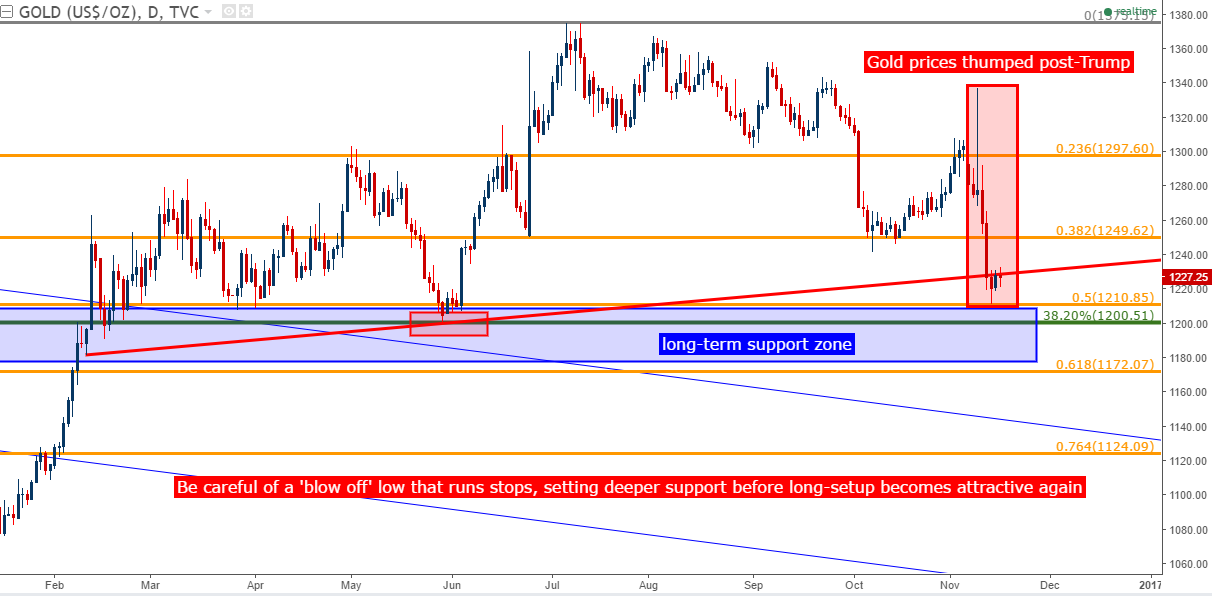
A major support level on Gold is at $1,200; this is the 38.2% Fibonacci retracement of the Bretton Woods-fix to the 2011-high, and has also provided the swing-low in May.
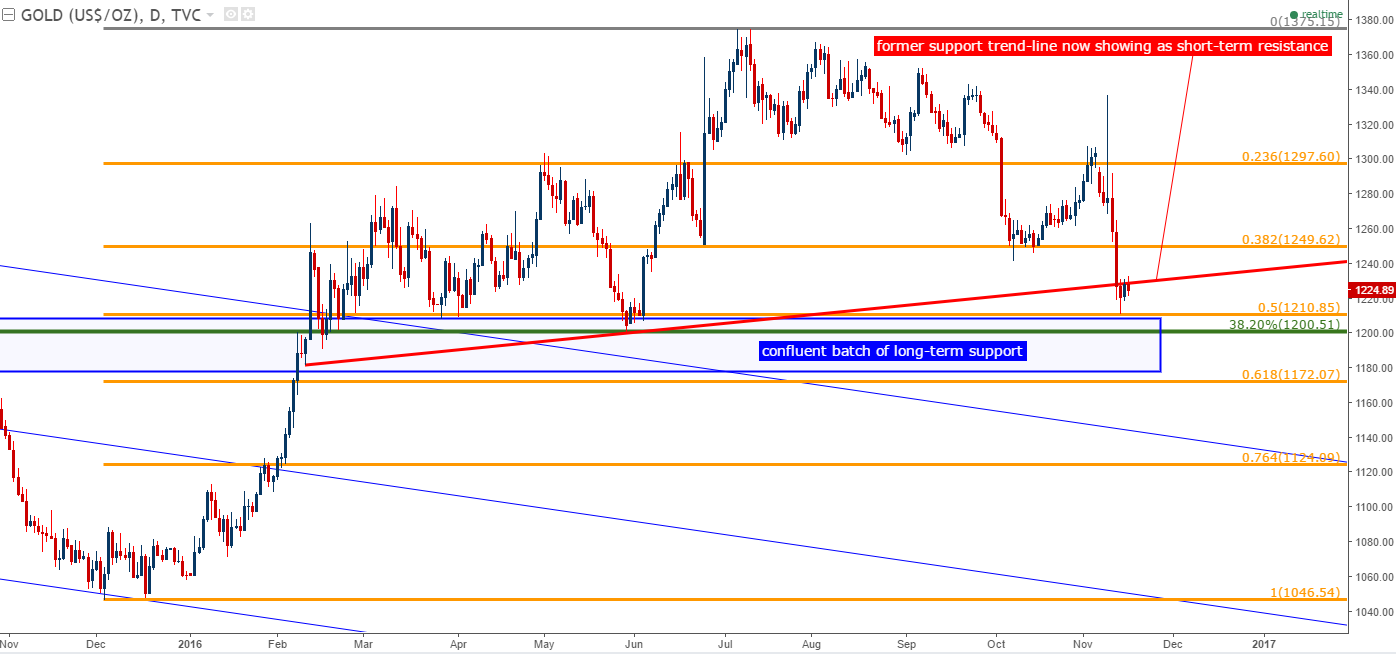
In our last article, we looked at the deluge in Gold prices as a ‘big picture,’ long-term support zone was nearing. The swing-low on Monday of this week came-in right at the 50% Fibonacci retracement of the December low to the July high at a price of $1,210.85. But just below that level is a more critical zone of potential support at $1,200, as this is the 38.2% retracement of the Bretton Woods Fix of $35/ounce up to the 2011 high of $1,920. Perhaps more importantly, this level has been recently confirmed as support with an inflection marking the lows in May.
On the chart below, we’re looking at the 2016 move in Gold prices, and we’ve added a short-term trend-line connecting the lows inprice actionsince February 10th.
Since that support inflection at $1,210, sellers have begun to display a bit of tepidness. This has allowed prices to trickle back-up to the $1,230-level, and short-term price action is now finding resistance on the projection of the short-term trend-line that we looked at above. But sellers have been unable to re-take control of Gold prices over the past two days, as we’re also seeing some element of ‘higher-lows’ on the hourly chart.
So while the near-term trend is still very much bearish here, seller’s conviction appears to be waning, and should the rampant strength seen in the U.S. Dollar of recent begin to recede, the long side of Gold can become attractive again. Of particular interest to this theme will be resistance levels at $1,230 and $1,250. The level at $1,230 has shown as near-term swing-resistance, and $1,250 is aFibonacc`i levelthat had also provided the swing-low during the Brexit referendum.
Until those highs are taken out, traders will likely want to move forward with a bearish bias on Gold.
Move over Snapchat, there"s another app where teenagers are flocking to post their selfie videos.
With more than 100 million users worldwide,musical.ly is the first social media app out of China that"s hit the jackpot in the United States. It"s filled with teenage girls and 20-somethings making funny faces into their smartphone cameras as they lip sync and mime the lyrics of hit songs.
The formula clearly works. Musical.ly has attracted celebrities like Ariana Grande, partnered with the NFL and turned several American teenagers into online stars.
Its success as a Chinese app in the U.S. is "frankly unique," said Danielle Levitas, head of research at analytics firm App Annie.
A video posted by musical.ly (@musical.ly) on Oct 21, 2016 at 12:19pm PDT
The app"s 37-year-old co-founder Alex Zhu says inspiration struck when he was sitting next to a group of teens on a train in California, where he was working at the time.
"Half of them were listening to music with earbuds, and the other half were constantly taking pictures or videos and making fun of each other," he told CNNMoney. "They love music, videos and social media ... why don"t we combine these three things into one product?"
He and his team in Shanghai launched the app in English and Chinese. Once the downloads in the U.S. started to take off, they decided to focus solely on that market. It"s now where most of the app"s users are based.
Zhu describes American teenagers as "the golden market" for new social media platforms. "They have time and creativity, and they share things all the time on social media, in school, and on the school bus," he said.
The most popular "muser" -- as musical.ly users are known -- is 15-year-old Ariel Martin from Florida. She was one of the app"s early adopters and now has more than 14 million followers.
Under the name "BabyAriel," Martin is credited with creating the signature look of musical.ly videos -- miming lyrics with hand gestures, using exaggerated facial expressions and moving the camera to create new angles.
"I was like, what if we like actually made it entertaining and made it fun to watch?" she told CNNMoney.
A video posted by Baby Ariel (@babyariel) on Sep 24, 2016 at 5:04pm PDT
Martin"s musical.ly fame has helped her build massive followings on YouTube and Instagram. She sells her own branded merchandise -- including lipstick and phone grips with images of her blowing a kiss -- and tours the U.S. meeting fans.
"I"m online schooled now because I"m traveling so much," she said.
Martin and other celebrity musers help keep the app"s regular users glued to their phones.
On average, people spend about 3½ minutes in musical.ly every time they open the app, a lot longer than the 2 minutes they spend in Instagram and 1½ in Snapchat, according to app analytics firm Sensor Tower.
But musical.ly still lags the competition in sheer numbers of active users. It has about 20 million monthly active users in the U.S., compared with more than 60 million for Snapchat and close to 90 million for Instagram, according to data from Survey Monkey.
Musical.ly is also constantly adding new features to try to keep users hooked -- letting them post videos that are longer than the original 15-second limit, adding stickers and promoting live broadcasts on sister app live.ly.
The company chats every day with hundreds of its users on Chinese messaging app WeChat to get feedback on planned changes.
The next step, analysts say, is figuring out how to make money.
"They started introducing in-app purchases this summer. It"s still too early to tell how successful it is, but they went from making no money, to pretty significant numbers in the last few months," said Wes McCabe, a marketing expert at Sensor Tower.
Musical.ly and live.ly are also in a good position to lure advertising from the music industry, he said.
Celebrity musers can now make money by receiving virtual gifts from fans, a concept that is well known in China, which has a huge live-streaming community.
Musical.ly is also looking to expand internationally. It has strong followings in the U.K. and Germany, and Zhu said the company still has high hopes for China.
But Chinese social media platforms need to secure celebrity endorsements and professionally produced content in order to attract users, according to Zhu.
"Once we have bandwidth, we can find a good way to enter," he said.
In the meantime, China"s big social media success in the West remains largely unknown at home.
To receive James Stanley’s Analysis directly via email, pleasesign up here.
The post-Election rally continues to driveprice actionacross global markets with continuation moves being seen in key areas like the U.S. Dollar, non-Tech U.S. Stocks and the even the Japanese Yen. And for a world that has gotten so comfortable with the ‘Fed Feedback Loop,’ the fact that traders are driving for higher-highs in both the Greenback and Stocks at the same time might be a bit disconcerting.
The Fed has been trying to hike rates for well over a year now. After ten years without a hike and rates staying near-zero, American companies have gotten very comfortable with the ‘extremely accommodative’ operating environment brought upon by the Federal Reserve’s ‘emergency-like’ monetary policy. But this isn’t a long-term strategy: Such low rates bring upon risks to savers, retirees and pretty much anyone that depends or will depend on interest rates at some point in their lives. And with demographic trends of retiring baby-boomers combined with declining labor force participation rates, this isn’t something that can last for too much longer. Social Security, Medicaid – these are very real problems that are made even more problematic by continued near-zero rate policy. So, there’s a very real drive to want to kick rates higher; the only problem is that each time the Fed has tried to do that over the past 18 months, equity markets have fallen and the headlines have been rife with ‘2008 all over again’ types of headlines.
This has created what many market participants call ‘The Fed Feedback Loop.’This is when the Fed will talk up the prospect of higher rates while stocks are at or near highs, only to backtrack and get dovish after stock prices soften or sell-off. Effectively, this presents the situation in which equity market prices are loosely driving interest rate policy, and this is far from the design of what the Federal Reserve is supposed to do. At the center of the argument is ‘The Wealth Effect’ and how this may impact income inequality, but that’s another topic for another article.
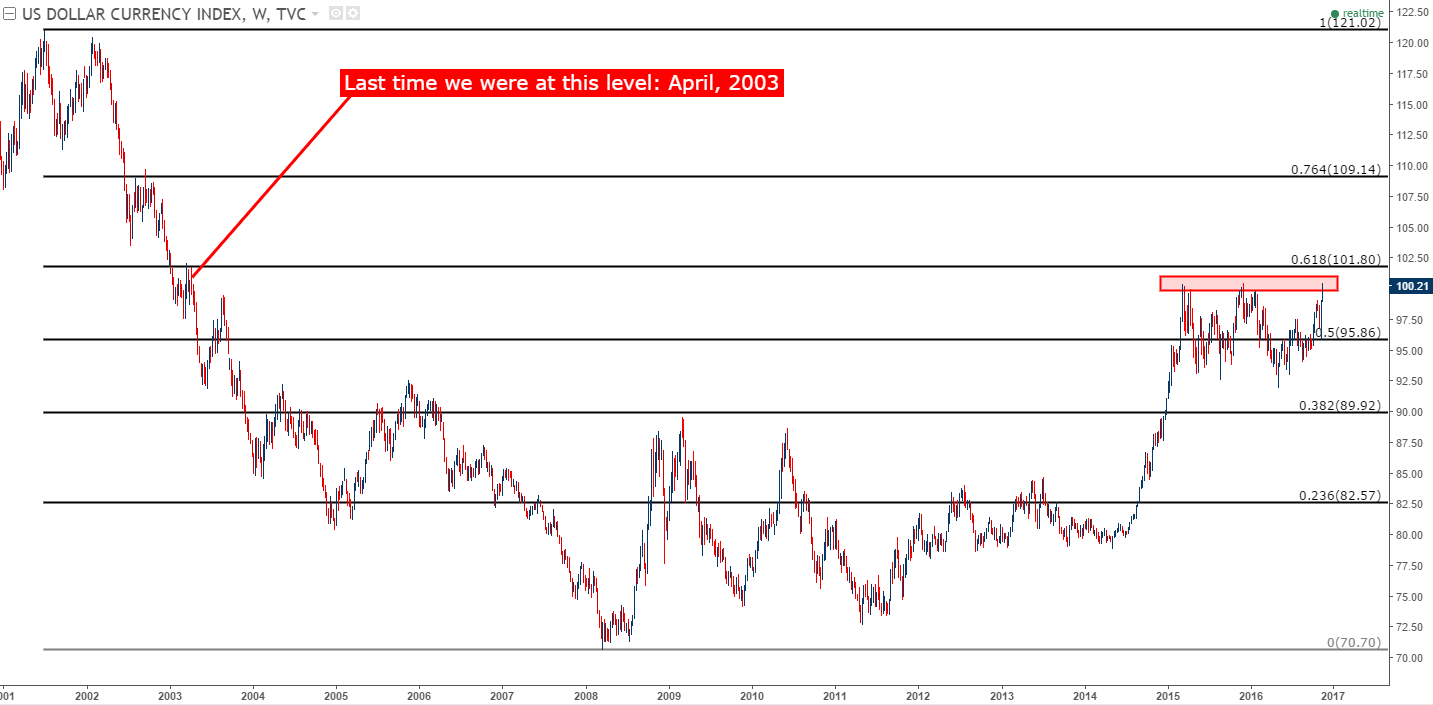
Pertinent to our current demands, however, is the price action setup in the U.S. Dollar. In the wake of the U.S. Presidential Election, the U.S. Dollar has driven to fresh 13-year highs. Stocks are also driving to fresh highs, with the Dow Jones Industrial Average setting another new all-time high in the overnight session. Given that stock prices are near-highs, this could be an ample opportunity for the Fed to kick up that next hike, and markets are currently pricing in a near-100% probability of a move-higher in December. More pertinent, however, will be what the Fed says about their plans for rate hikes in 2017. Last year, the Fed posed the first hike in over nine years when moving rates up in December. But they also said that they wanted to hike rates a full four times in 2016, and within weeks of that rate hike equity markets had collapsed for fear of rates tightening too quickly while the global backdrop (Chinese markets) remained weak.
On the chart below, we’re looking at the past 15 years of price performance in DXY, representing the U.S. Dollar. And below that, we’re looking at various ways that traders can look to position around the Dollar in the coming days/weeks.
With USD currently sitting at fresh 13-year highs, traders would likely want to wait for a pullback to support before looking to add long exposure.
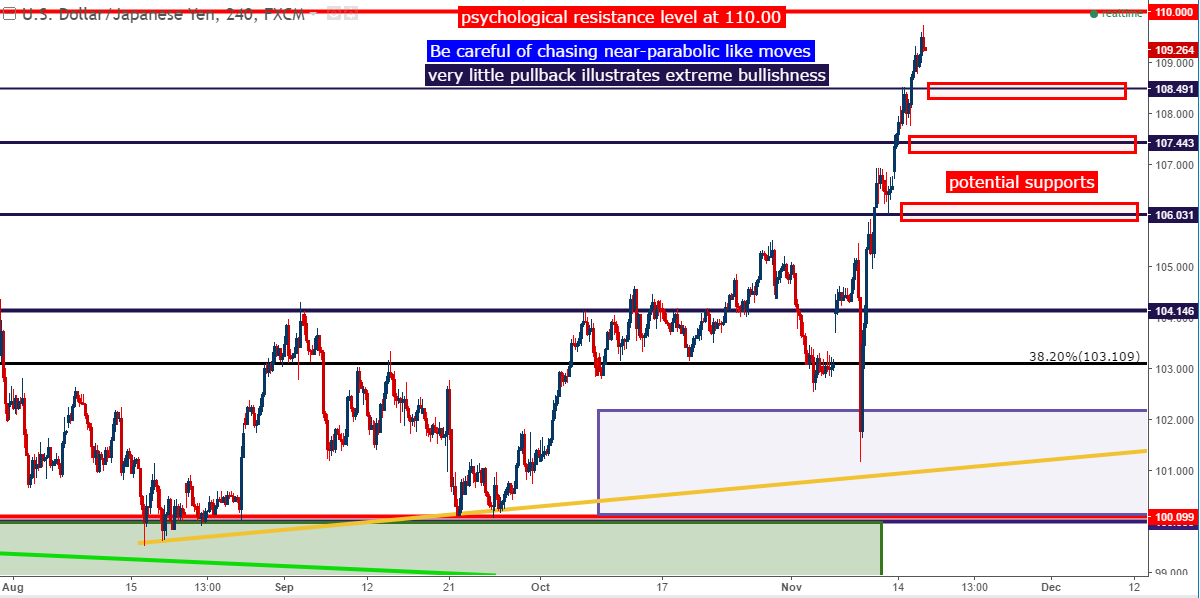
This is a setup that we’ve been talking about for a couple of monthsas the pair dug-in support around the 100-level. And this has been one of the more attractive venues to voice long-USD trades in the post-Trump environment, looking to play divergence between the U.S. and Japanese economies. USD/JPY is up over 800 pips since the lows of election night, and given the prospect of continued divergence between the U.S. and Japanese economy, particularly in a long-USD, rising rates scenario, this pair can continue to be attractive.
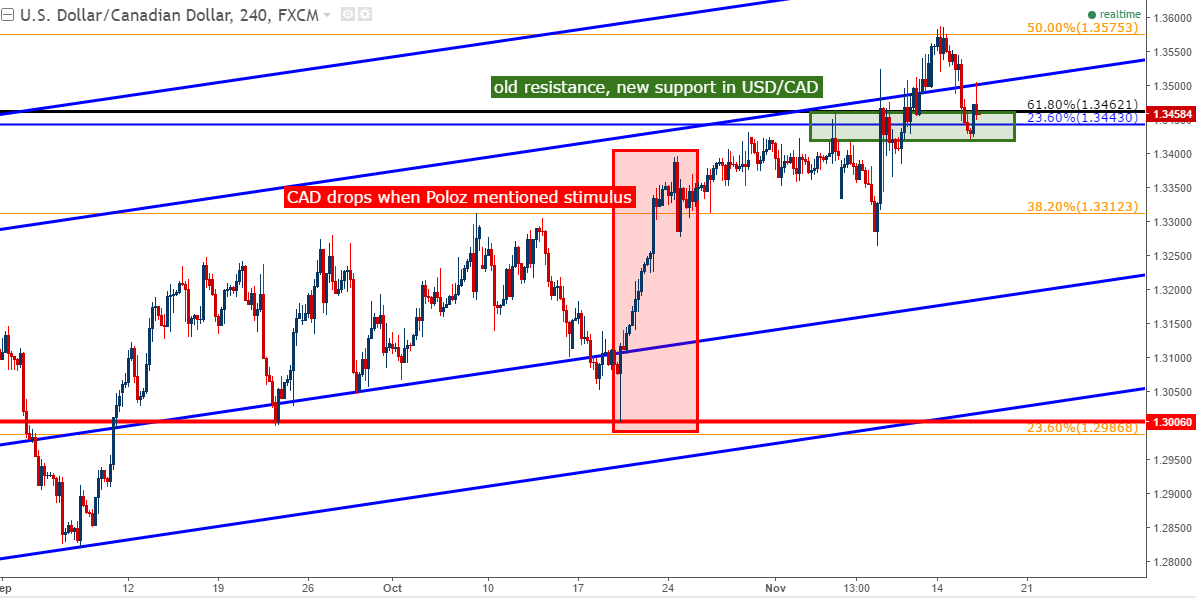
Another pair with the prospect of continued monetary divergence between parent economies in the scenario of continued USD-strength is USD/CAD. Just a couple of weeks ago, Stephen Poloz of the Bank of Canada mentioned during a press conference at a rate decision that the bank had discussed monetary stimulus. This immediately prodded CAD-weakness as markets priced-in the prospect of stimulus down-the-road. Mr. Poloz tried to backtrack a few days later, giving a scope of ‘around 18 months’ for any potential future action, but by then the cat was already out of the bag and hopes for more stimulus kept the CAD weak. Should the U.S. Dollar continue higher, this can be another attractive venue to attain long-USD exposure.
Short-USD is going to be a bit more difficult to work with at the moment given how strong the U.S. Dollar has been; but given this recent bout of strength, we can deductively find areas that could be attractive in the event that this theme of bullish USD doesn’t continue.
In March, USD/CHF set a swing-high at 1.0092, and as long as price action continues to respect this high, traders can watch for resistance with the aim of trading the pair-lower.
This is another area that may be deductively showing us something given the fact that the past couple of days have seen higher-highs on the Dollar,yet Gold prices have remained supported. Should the Fed backtrack or should USD weaken on the prospect of continued loose monetary conditions, Gold prices could certainly get bullish again.
However, it would appear that we’re not at a junction in which the Fed will get dovish all of the sudden. And given how sharp Gold prices have moved this year around the Fed, traders may want to wait for a ‘blow off’ move that sees prices move lower before looking to buy support.
Factory owners weigh in on potential tariffs on Chinese exports to the US
Donald Trump the campaigner talked tough on China: He threatened to slap tariffs of 45% on Chinese exports, and promised to label Beijing a "currency manipulator."
"We can"t continue to allow China to rape our country, and that"s what they"re doing," he told supporters in May.
This Japanese city wants to be the next startup hub
There"s a new contender for Japan"s most innovative city.
Down south on the island of Kyushu, Fukuoka is cultivating a budding startup scene. Home to 1.5 million people, the industrious port city welcomed 2,800 new companies last year, cranking out everything from social messaging apps to task-management tools.
The growth represents a 7% annual increase in startups -- the highest rate among all 21 Japanese metropolises. And the number of startups isn"t the only thing that"s growing.
In a country where most areas have an aging and shrinking population, Fukuoka is experiencing the opposite. From October 2010 to 2015, the seaside city saw a 19.5% growth rate for young residents between the ages of 15 and 29.
Japan"s youngest mayor in Fukuoka"s history -- Soichiro Takashima, now 42-- is the driver behind the city"s ambitions to become a startup hub. He was just 36 when he assumed the role.
"We can"t just go with the flow," Takashima told CNNMoney. "We want to carve out a new era."
A view of Fukuoka City, in the southern main island of Kyushu.
Planning ahead
At the moment, Japan"s startup culture only makes up 4% of the country"s companies. Takashima attributes this to high corporate tax rates, an expensive cost of living and low incentives for foreign investment.
Plans for a change started in 2012 when Takashima announced the "Startup City Fukuoka Declaration."
Since then, the government has streamlined bureaucratic hurdles, cut taxes for new businesses and made it easier to hire foreigners with a dedicated Startup Visa.
A sharing economy
The momentum can be seen via an uptick in collaborative coworking spaces.
For example, Startup Cafe -- tucked away in the Tsutaya Bookstore -- is the center of the mayor"s vision. The space, which is decked out in warm wood and communal tables, aims to provide entrepreneurs with everything they need.
In addition to Wi-Fi, visitors have access to a dedicated concierge team. The cafe"s multilingual staff regularly offers free workshops on topics like business models, prototyping, legal support, fundraising and visa support.
It"s offered more than 2,000 startup events, seminars and consultations since opening in 2014.
A downtown view of the port city of Fukuoka, aiming to be Japan"s startup hub.
"When you want to start your business, you can come here," said Thomas Pouplin, cofounder of Ikkai, a peer-to-peer platform that outsources tasks and posts jobs. "You"re going to get a lot of advice on how to build a business plan and how to do your financial plan."
Originally from France, Pouplin came to Fukuoka during business school as an exchange student. The new reforms have made it easier for foreigners to enter Fukuoka and start a business, he said.
Fostering homegrown talent
According to a 2012 Employment Status Survey, 12.3% of people aged 25 to 34 in Fukuokahave expressed interest in starting a business-- the highest rate out of 21 major cities surveyed in Japan.
Several startups have already taken off in the region, such as Line -- a popular messaging app with over 700 million users worldwide. Its strongest user base is in Asia.
Cherry blossoms in full bloom at Maizuru Park in Fukuoka, Japan.
There"s also Nulab, an app suite that lets teams collaborate on online projects. It has more than 2 million users around the world.
"In Tokyo and Osaka, people start businesses using a top-down model," Masanori Hashimoto, Nulab CEO, said.
But Fukuoka doesn"t have a strong hierarchical business environment. It"s easier to make connections, collaborate on ideas and attract new talent, Hashimoto said.
Live a little
Livabilityis another crucial factor when it comes to growing a startup hub, Takashima said.
"Seattle was the first city that inspired me," Takashima said. "I wondered why mega ventures like Amazon, Costco, Starbucks and Microsoft were born in a port town far from the capital."
"I thought Fukuoka had a lot in common [with Seattle]."
Cherry blossoms at the ruins of Fukuoka Castle in Fukuoka, Japan.
Fukuoka was ranked no. 7 in the world by Monocle magazine as most livable city in 2016, due to its access to nature, transportation, affordable rentand culinary options.
The region is also a short drive to hot springs, beaches and mountains -- a far less stressful environment than Tokyo.
"Creating a company is stressful enough, but creating it [in Fukuoka] removes a lot of stress," said Yasime Djoudi, cofounder of Ikkai. "It makes you focused and creative, so maybe it"s a recipe for more success."
Jeffrey Smith, Managing Member, CEO and Chief Investment Officer for Starboard Value LP., speaks at the Sohn Investment Conference in New York City, U.S. May 4, 2016.
The mixed reaction to the U.K. Jobless Claims report may keep GBP/USD in a narrow range as the pair remains capped by the Fibonacci overlap around 1.2630 (38.2% expansion) to 1.2680 (50% retracement), while near-term support comes in around 1.2360 (50% expansion); may see the British Pound extend the relief rally carried over from the previous month as long as the upward trending channel remains in play.
A 0.4% rebound in U.K. Retail Sales may increase the Bank of England’s (BoE) scope to gradually move away from its easing-cycle as private-sector consumption remains one of the leading drivers of growth, and GovernorMark Carneymay largely endorse a wait-and-see approach in 2017 as the central bank head warns ‘monetary policy can respond, in either direction.’
Break/close below1.2360 (50% expansion)shifts the focus to thenext downside target around 1.2270 (23.6% retracement) followed by 1.2100 (61.8% expansion).
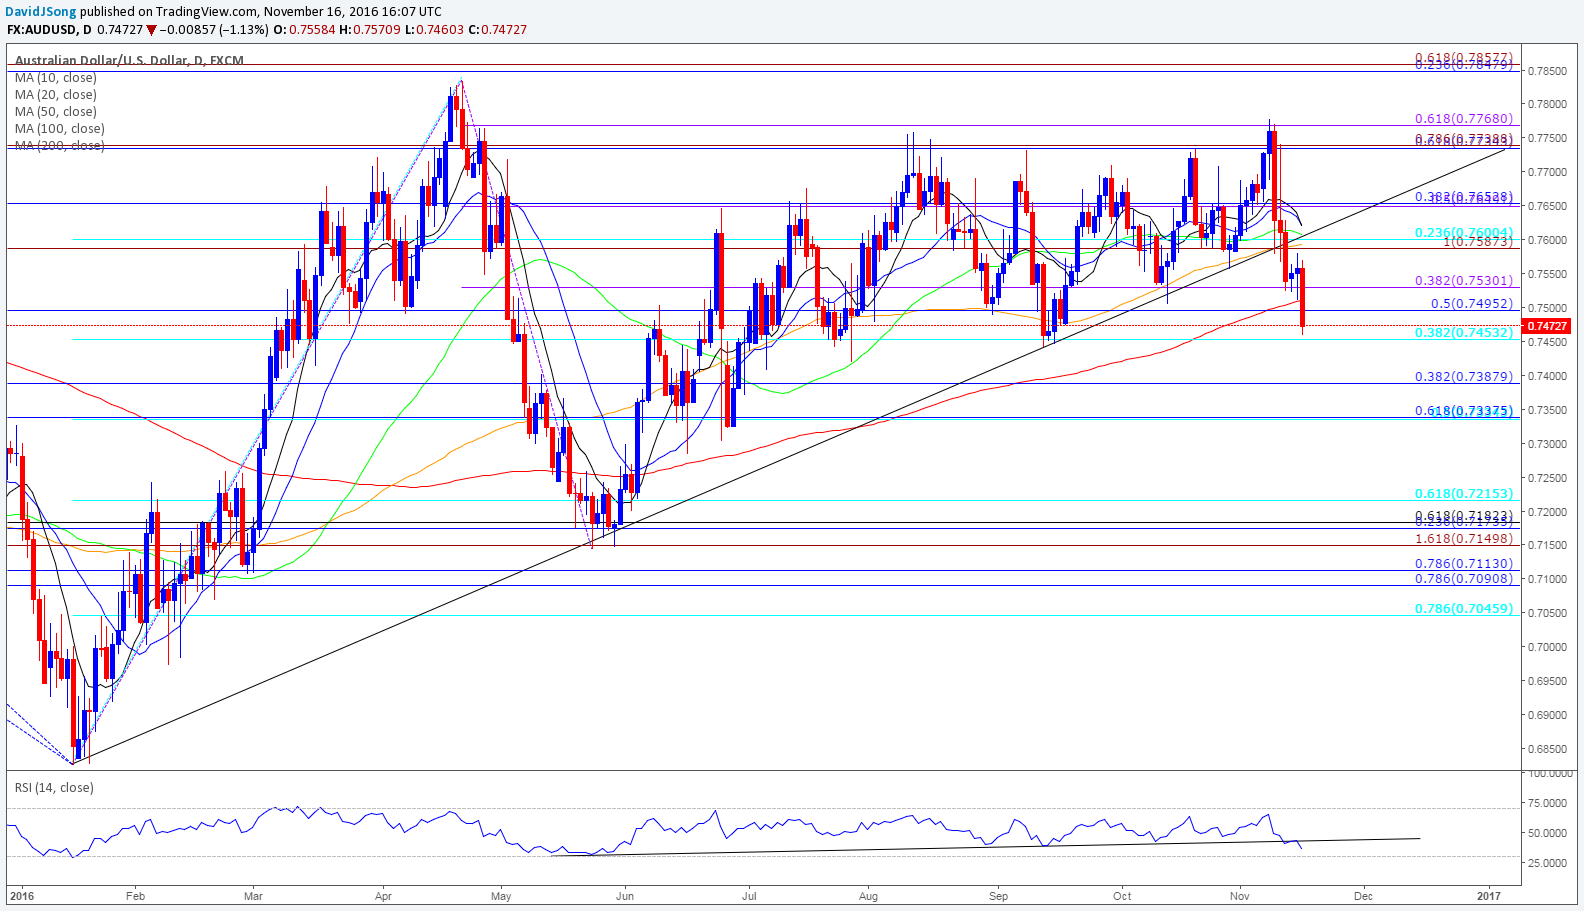
Despite the limited market reaction to Australia’s Wage Price Index (WPI), AUD/USD stands at risk of extending the decline from earlier this month as it breaks down from the upward trend from earlier this year, with the Relative Strength Index (RSI) following suit; the recent developments highlight a potential shift in market behavior following the failed attempt to test the 2016 high (0.7834) accompanied by the break of theOctober low (0.7506).
With Australia Employment projected to pick up for the first time in three-months, a 15.0K expansion may spark a rebound in the exchange rate, but another dismal labor report may spur a test of the of the September low (0.7441) as it dampens the outlook for growth and inflation; even though the Reserve Bank of Australia (RBA) endorses a wait-and-see approach going into 2017, may see GovernorPhilip Loweand Co. change their tune should the key data prints coming out of the real economy continue to disappoint.
The broader outlook for AUD/USD is coming increasingly bearish, with a break/close below 0.7450 (38.2% retracement) opening up the next downside target around 0.7390 (38.2% retracement) followed by the Fibonacci overlap around 0.7330 (50% retracement) to 0.7340 (61.8% retracement).
TheDailyFX Speculative Sentiment Index (SSI)shows the FX crowd remains net-long since even after the British Pound ‘flash crash,’ with retail sentiment hitting a 2016-extreme of +5.97 during the previous month, while traders have been net-long AUD/USD since November 9.
GBP/USD SSI sits at +1.68 as 63% of traders are long, with short positions 29.4% higher from the previous week even as open interest stands 12.1% below the monthly average.
AUD/USD SSI sits at +1.96 as 66% of traders are long, with long positions 77% higher from the previous week, while open interest stands 1.5% above the monthly average.
Have yet to see a full-return of market participation as open interest across the major currencies remain on the lighter side.
Why and how do we use the SSI in trading? View our video and download the free indicatorhere