Forex news for trading on March 31, 2017
- US stocks end the day lower. The quarter was a different story.
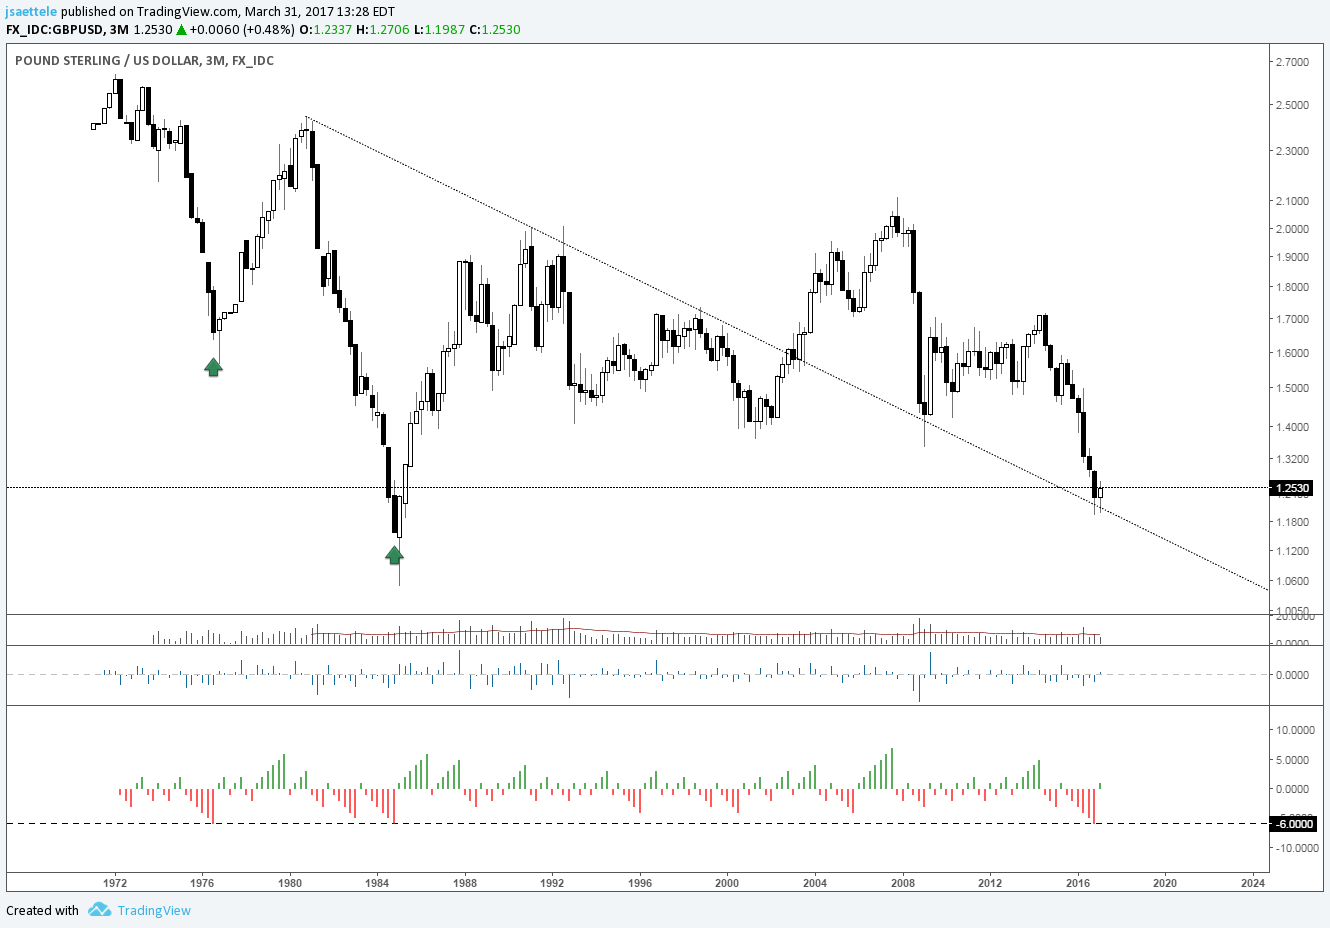
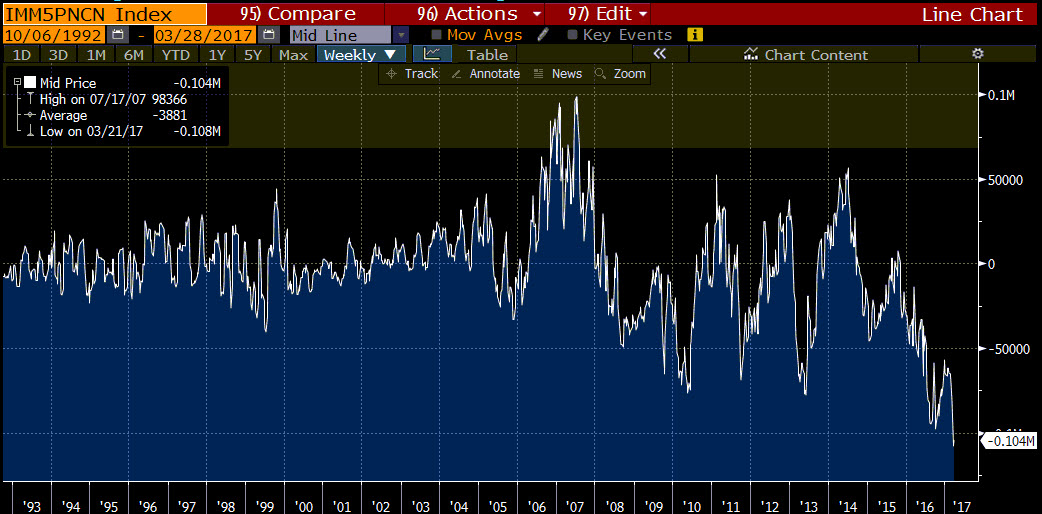
- CFTC Commitment of Traders: GBP shorts remain near record levels. EUR near square.
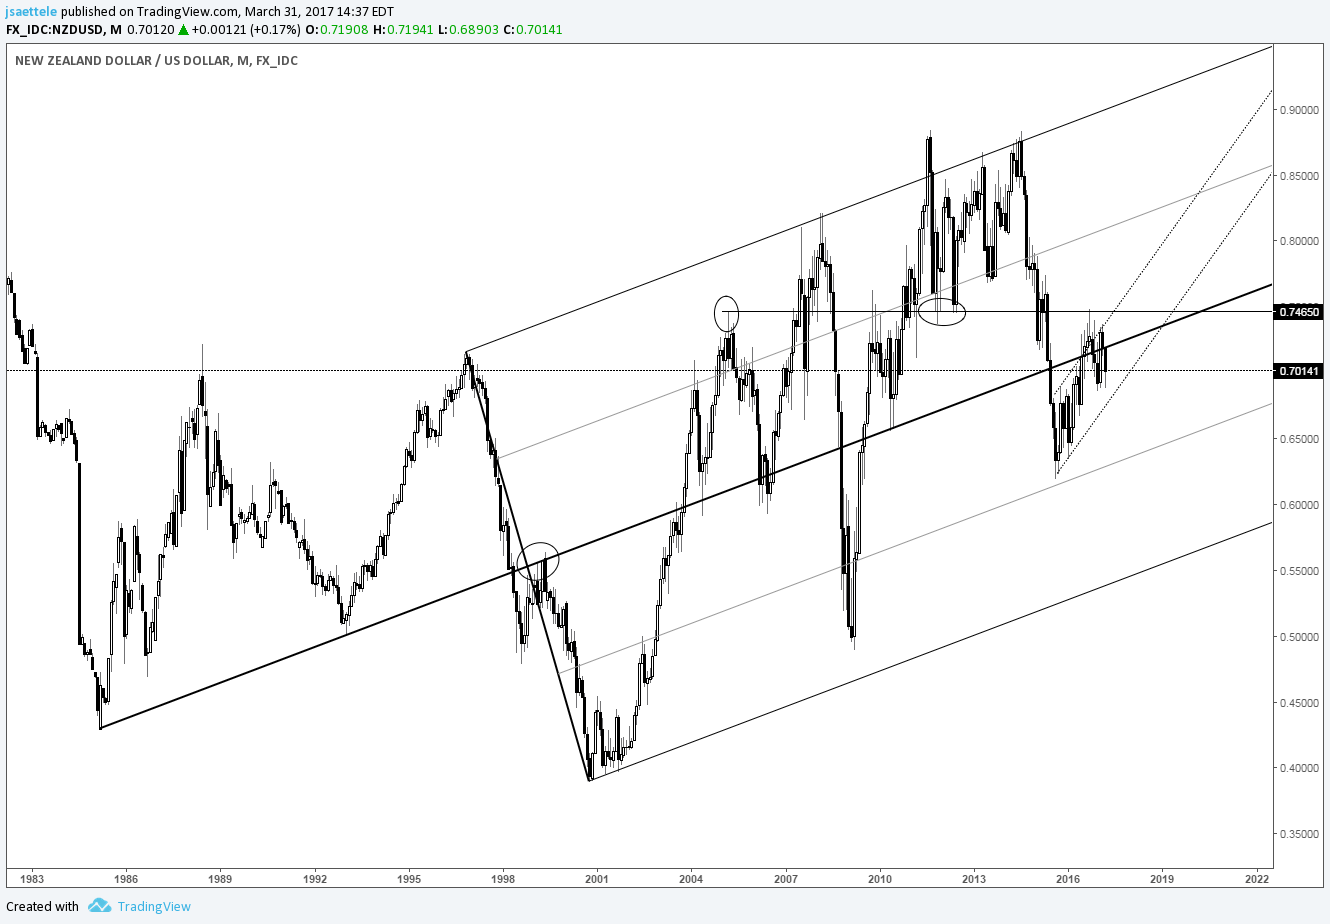
- Forex technical analysis: NZDUSD stalls at 100 hour MA
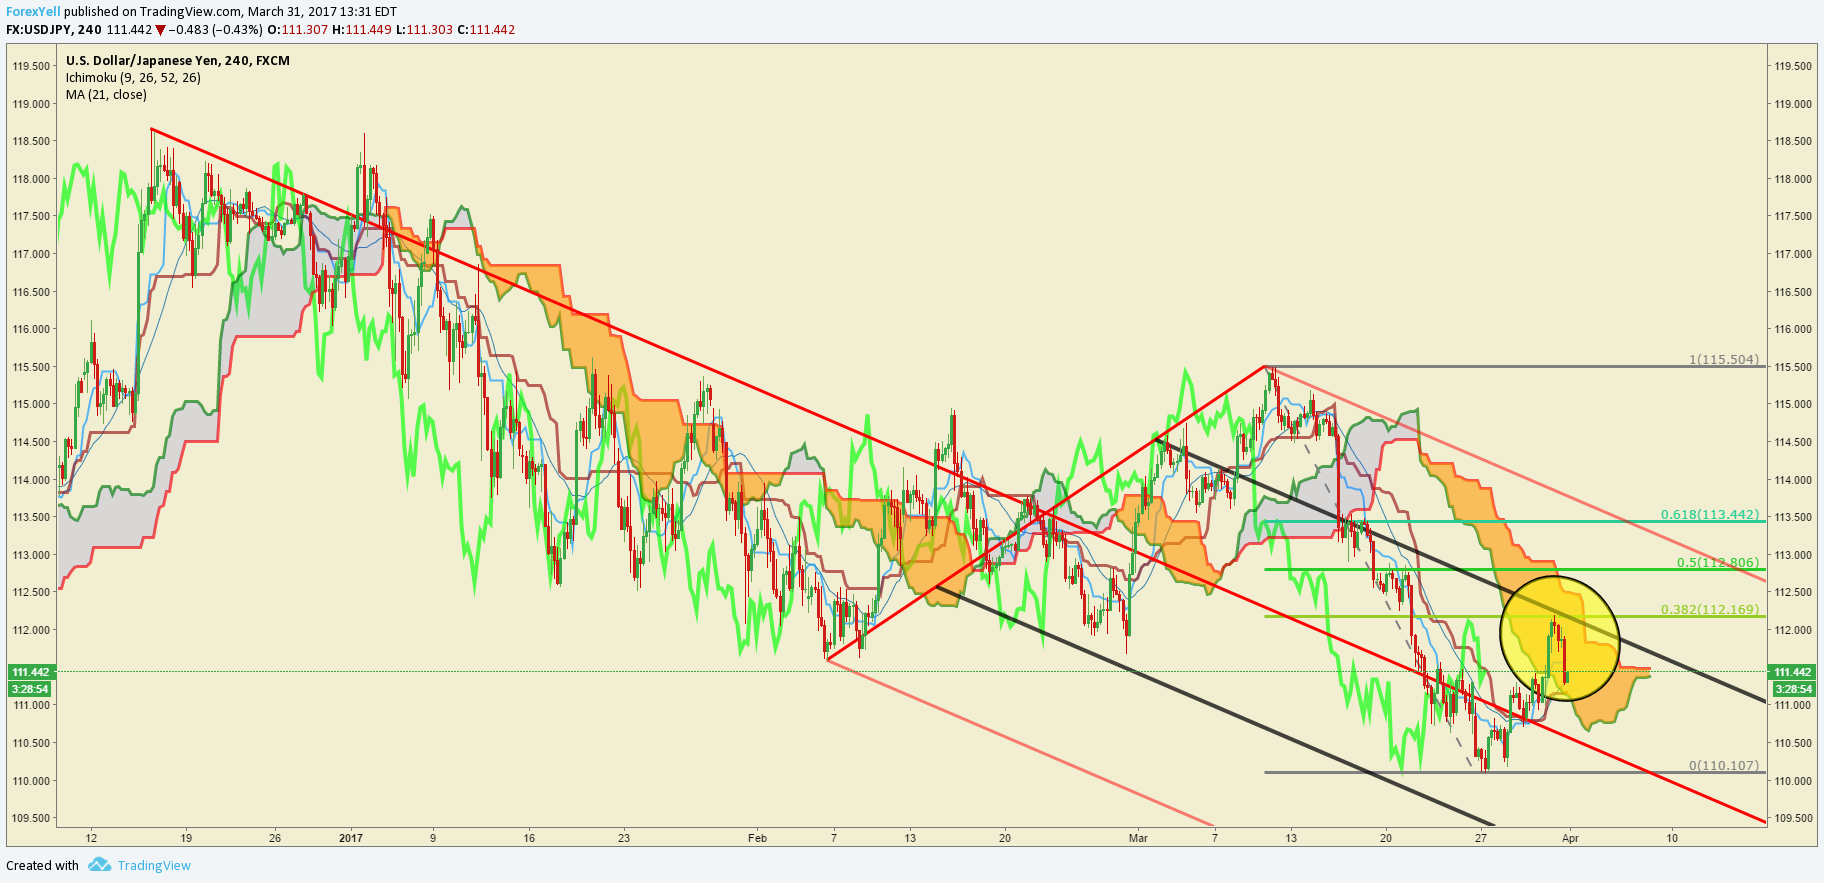
- Forex technical analysis: USDJPY wanders back toward the 100 and 200 hour MA
- US Baker Hughes rig count total up to 824 from 809. Up 15.
- More Bullard: On balance sheet, Fed could be ready to go by 2H 2017
- JPM Q1 GDP tracker to 1% from 1.5% - Livesquawk
- BOC Poloz: Canada GDP was good, but...
- NY Fed Nowcasting 1Q GDP dips to 2.9% from 3.0% last week
- Senate intelligence committee turned down Flynn"s request for immunity
- Fed doves favor shrinking of balance sheet...
- Goldman cuts 1Q GDP growth to 1.5% from 1.8% - Livesquawk
- Feds Bullard: This does not sound like a booming US economy
- Feds Kashkari: Fed needs to be more transparent about decisions
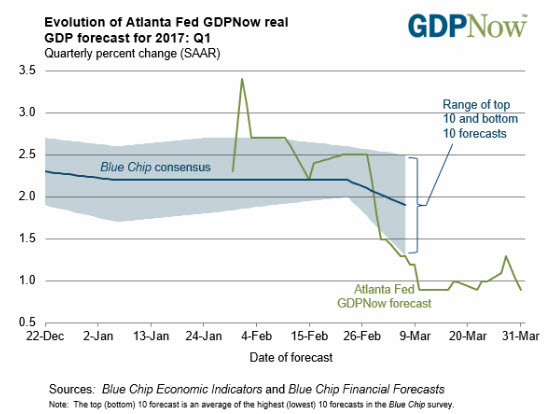
- The Atlanta Fed GDPNow estimate for 1Q GDP growth 0.9% versus 1.0% last
- Mexico"s finance minister expects 2017 GDP 1.3%-2.3%
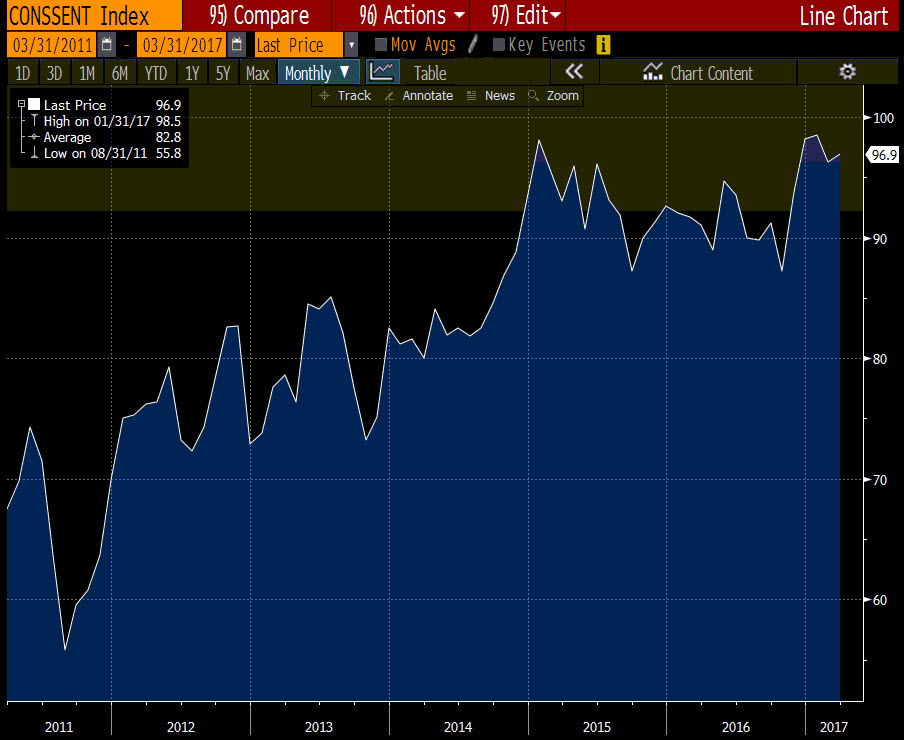
- University of Michigan consumer sentiment (final) 96.9 vs. 97.6 est.
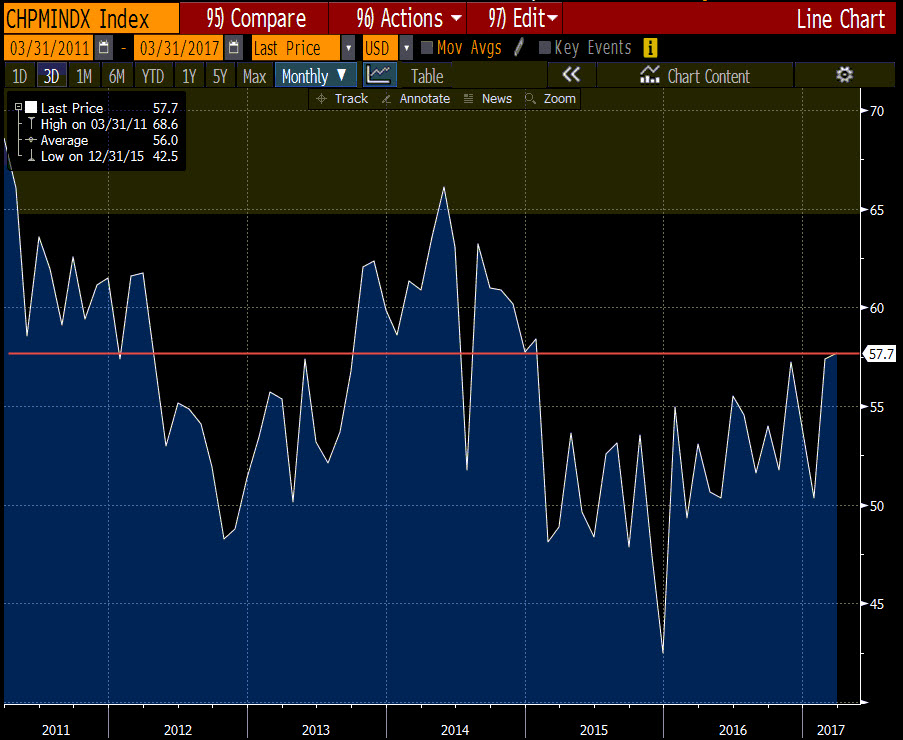
- Chicago purchasing managers index 57.7 vs 56.9 est
- Fed"s Dudley: A couple more rate hikes seems reasonable
- Canada MoM GDP MoM 0.6% vs. 0.3% est., YoY 2.3% vs. 1.9%
- February 2017 US PCE 2.1% vs 2.1% exp y/y
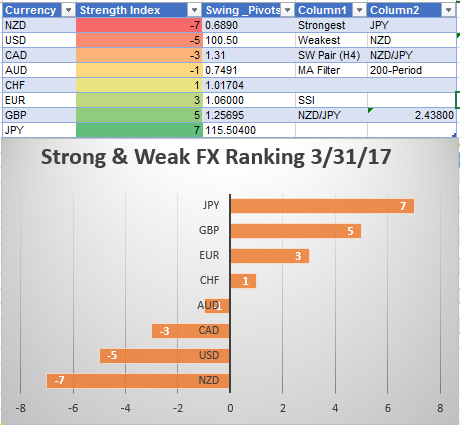
- The strongest and weakest currencies as NA traders enter for the day
In other markets:
- S&P index fell by -0.23%
- NASDAQ composite index fell by -0.04%
- Dow industrial average fell by -0.31%
- Two-year notes 1.258%, -2.3 basis points
- five-year note 1.924%,, -3.9 basis points
- 10 year note 2.391%, -2.8 basis points
- Spot gold $1248.03, +$5.30, +0.43%
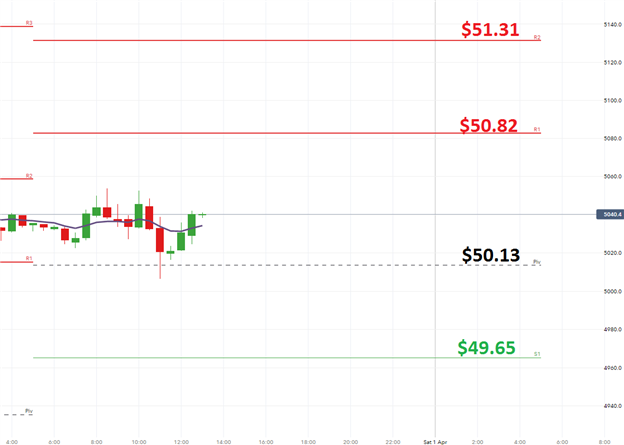
- Crude oil futures $50.75, $.41 or +0.1%
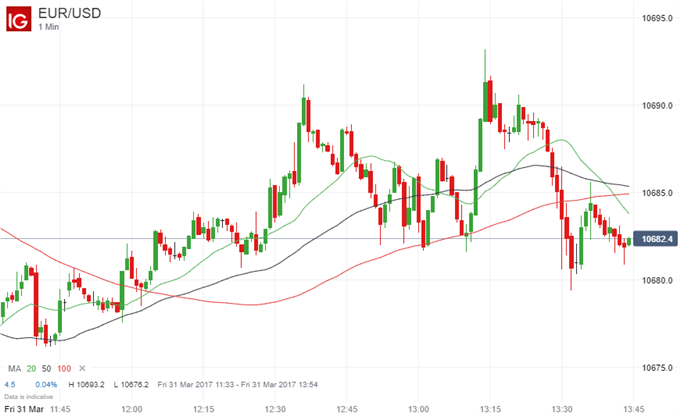
Today was the end of the week,, the month and the quarter. The most action was centered in the GBPUSD, USDJPY and USDCAD. The EURUSD, USDCHF, AUDUSD and NZDUSD traded most of the day with little movement although, there is some dollar buying at the end of the NY session that is extending the ranges a bit for some currency pairs.
Economically, today, the US personal spending rose by 0.1% vs 0.2% estimate. Income was higher by an expected +0.4%. Later there was mixed news with Chicago PMI higher than expectations at 57.7 vs 56.9 while the University of Michigan sentiment final numbers were less than expectations at 96.9 vs 97.6 est. The data did not have a great impact on the currency rates.
There were some Fed speakers today with Feds Dudley, Kashkari and Bullard all speaking. Kaahkari is a voting dove. He did not vote for the last Fed hike. Bullard also has dovish tendencies. He is non voting this year but said he can see gradual hikes, but also added the economy is not making the noise of a booming one. Dudley (voting) said that a couple more hikes in 2017 seemed reasonable and that the neutral target rate is 2-3%. What was interesting is Kashkari and Bullard both talked about being in favor of winding down the Fed"s balance sheet going forward.
How are the major pairs going out in trading today?
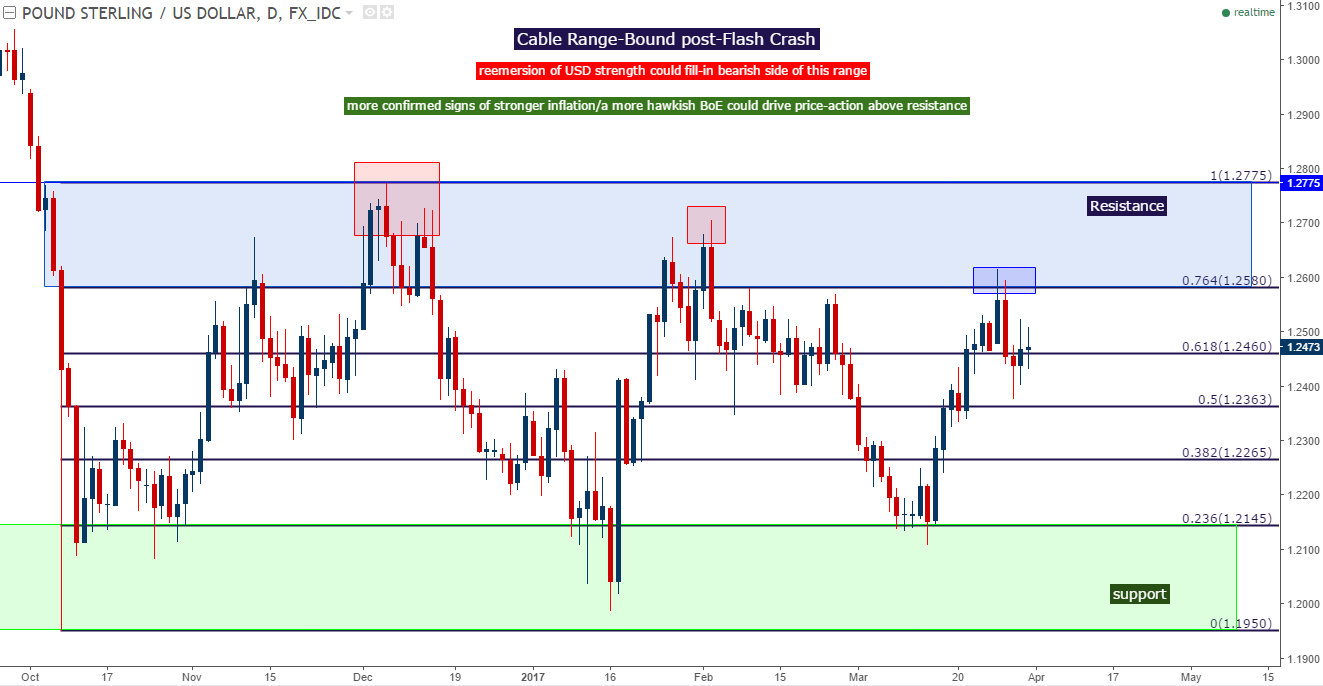
The GBPUSD moved up nicely - breaking away from the pairs 100 and 200 hour MAs at 1.2484 area in the process. The largest gains in the NY session got going in the last hour of trading in the London session. Was it some shorts covering into the weekend? Perhaps. Later in the day, the CBOT commitment of traders data showed that shorts in the GBP remained near record levels. Having a late day short squeeze higher after the market failed to stay below the 100 and 200 hour MAs makes more sense with the short backdrop of that pair. The price moved above the 1.2500 level and then the high from yesterday at 1.2523. That is bullish technical news going into the weekend. PS the EURGBP as stumbled lower
More.
Below is a snapshot of the % changes of the major currencies for the day.

How did the USD do for the week?
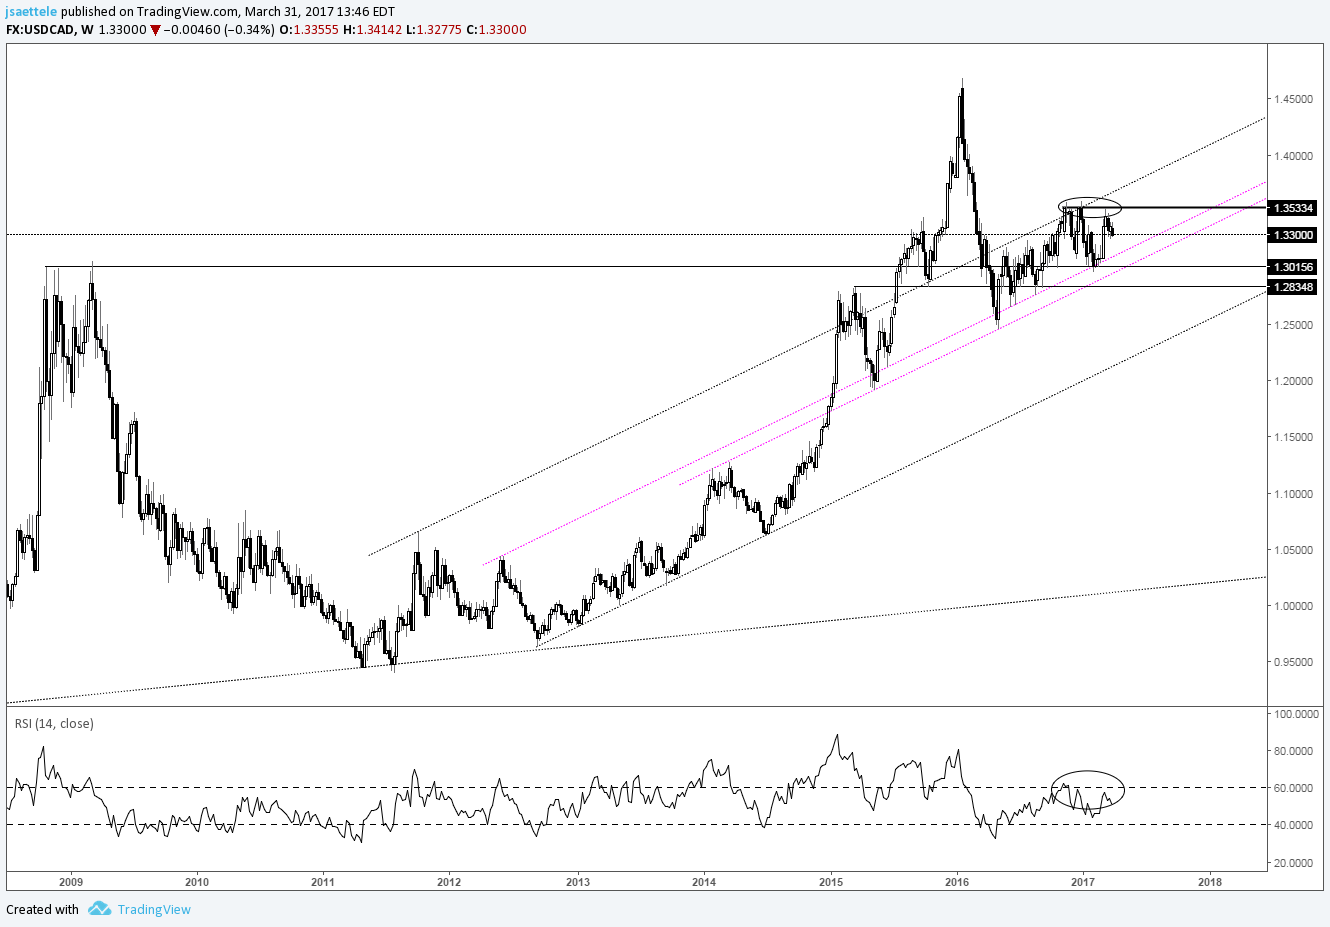
Looking at the chart below the dollar gained 1.31% against the EUR but lost 0.53% against the CAD

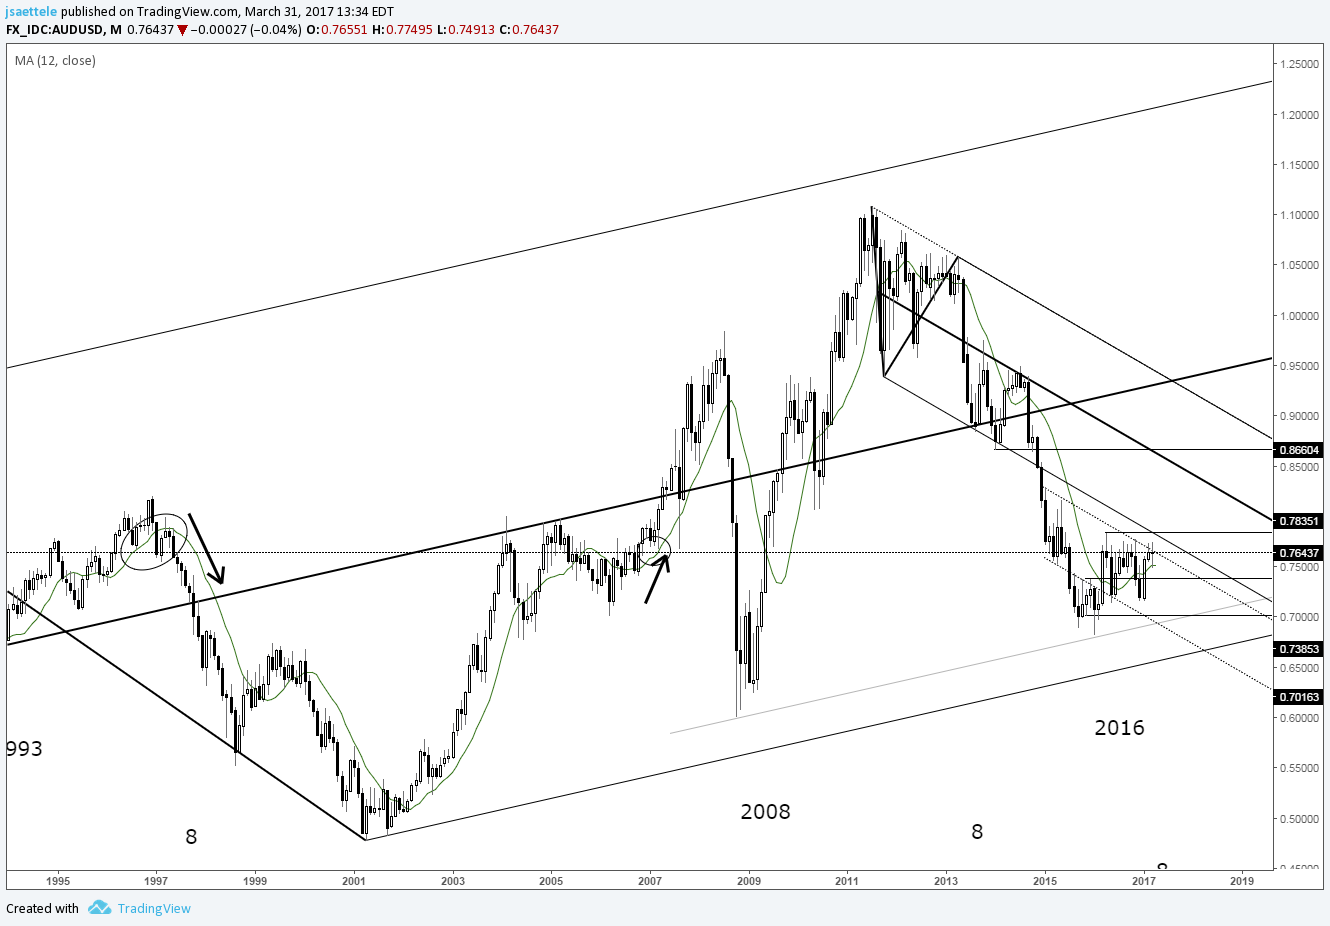
For the quarter, the dollar was a loser against all the major currencies with the largest percentage decline against the AUD (-5.92%).
The dollar was only weaker by 0.84% against the Chinese Renminbi. Pres Trump meets with the China"s President XI on April 6-7 at the "White House South". Needless to say, the discussion on the currency and trade will be #1 on the list for the global leaders of the worlds largest economies.

Forexlive Americas forex new wrap. Dollar mixed on quarter end day
Forexlive Americas forex new wrap. Dollar mixed on quarter end day
http://www.forexlive.com/feed/news
$inline_image !!! CLICK HERE TO READ MORE !!! Forexlive Americas forex new wrap. Dollar mixed on quarter end day Forex Blog | Free Forex Tips | Forex News http://www.forextutor.net/forexlive-americas-forex-new-wrap-dollar-mixed-on-quarter-end-day/