To receive James Stanley’s analysis directly via email, please SIGN UP HERE
Talking Points:
- The U.S. Dollar continues to drive higher after Friday’s FOMC comments began to stoke rate expectations higher for the remainder of the year out of the United States.
- This isn’t the first time that the Fed has taken a hawkish stance to talk up near-term rate hikes, even in 2016. But does this mean that the bank will actually hike?
- If you’re looking for trading ideas, check out our Trading Guides. And if you want something more short-term in nature, check out our SSI indicator. If you’re looking for an even shorter-term indicator, check out our recently-unveiled GSI indicator.
One of the most pervasive themes in capital markets this year has been the shifting of market expectations around the Federal Reserve’s rate-hike plans. Coming into the year after the bank spent much of 2015 trying to prepare markets for a single interest rate hike, the Federal Reserve said that they expected to hike a full four times in 2016 in the effort of normalizing interest rate policy after 7+ years of ‘emergency like’ monetary structure.
This hasn’t worked out so well… Within weeks of that first interest rate hike in nine years, global markets began to collapse. And to be sure, this likely wasn’t entirely FOMC-related, as the confluence of pressure points in the global economy appeared to become exacerbated by these ebullient rate hike plans. But the Fed had an easy pathway to try to assuage the situation by adjusting those aggressive rate hike expectations lower in order to pacify risk aversion being seen around-the-world. So the Fed decreased expectations for rate hikes in 2016, and in short order, risk markets began bubbling higher, again.
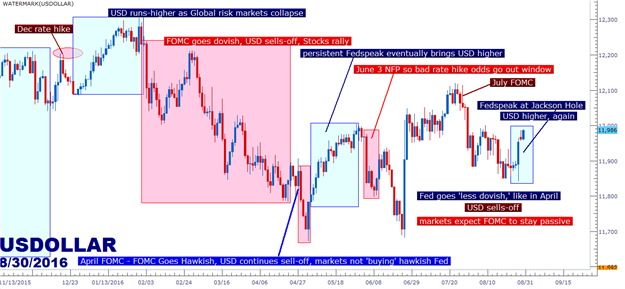
This thickens a plot that’s been rather pronounced over the past 18 months as the Fed has continually attempted to embark on the process of ‘normalization.’ As risk assets like the S&P 500 have run higher, the Fed has attempted to talk up interest rate hikes. When markets have responded by turning lower, the Fed then alters those expectations to become more dovish and passive, and strength in risk markets then returns. We’re referring to what’s become known as the ‘Fed Feedback Loop,’ in which the bank is apparently adjusting expectations for interest rate hikes with consideration of the ‘wealth effect,’ while using a subjective interpretation of the ‘dual mandate’ to support their thesis in either direction. On the chart below, we look at a visual illustration of the Fed Feedback Loop with annotations to denote key moves from the FOMC over the past year.
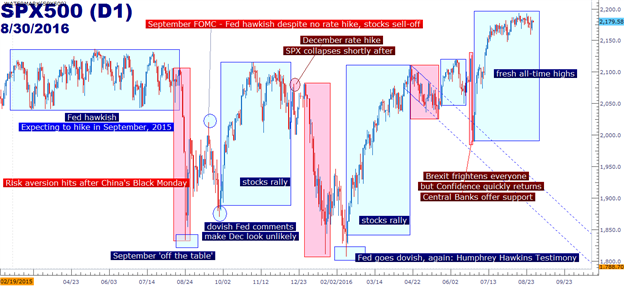
Created with Marketscope/Trading Station II; prepared by James Stanley
As risk assets began running higher again on the morning of February 11th, fresh on the heels of Chair Janet Yellen’s twice-annual Congressional testimony, fear began to abate as expectations ran-higher for the Federal Reserve to relent on their rate hike plans. This came to fruition in March, when the FOMC adjusted their rate hike expectations for 2016 from ‘four’ to ‘two.’ This brought more air in the sails for risk markets, and by the time we got to the FOMC meeting in April, the Fed was feeling as though markets were ‘underpricing’ the probability of a hike in June. This brought strength into USD and lower prices in Gold and Stocks throughout the month of May as various Federal Reserve members were continuing to talk up the prospect of higher rates at their next meeting.
These rate hike plans came crashing down on June 3rd when Non-Farm Payrolls came in considerably-below expectations. As NFP came in so far below expectations, markets began to price-in ‘looser for longer,’ as few expected the Fed to pose a hike in the face of slowing employment data, especially after the passive pattern that they’ve become well-known for. This implied loose monetary backdrop provided fuel for risk markets to run to even fresher near-term highs, and even the widely-panned Brexit referendum couldn’t provide a lasting dent to stock prices, as markets have come to expect Central Banks to backstop whichever risk factors may flare in the global economy.
But this just brought even higher prices to stocks, which means that the Fed may have just gotten some wiggle room to try to adjust-higher rate expectations for the remainder of the year.
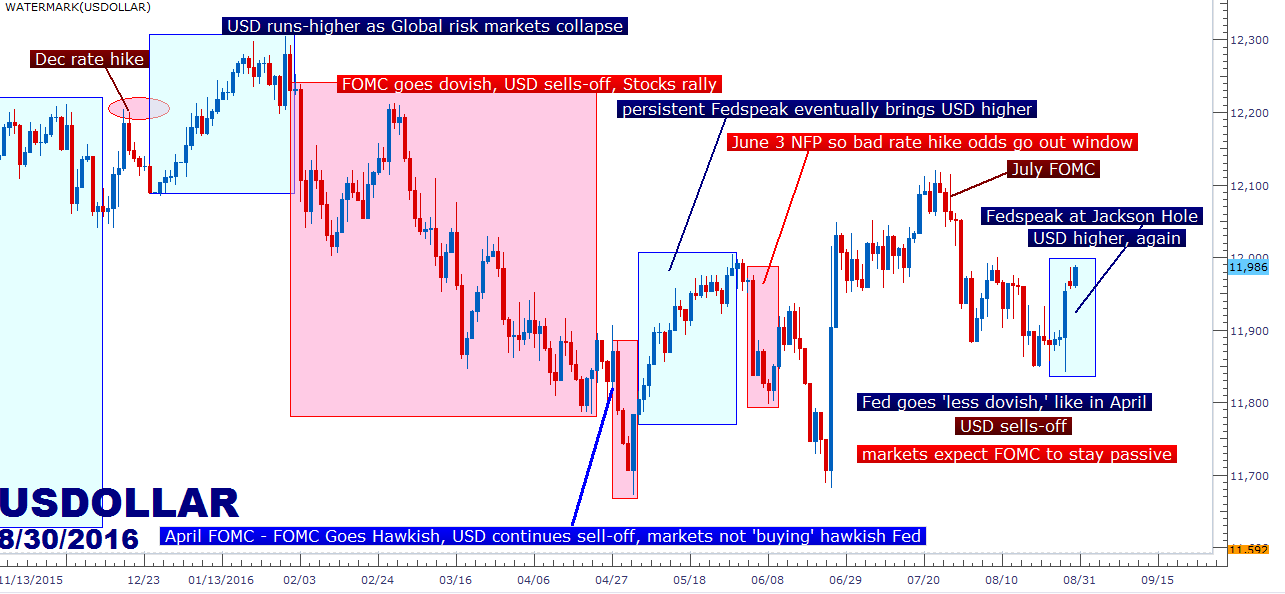
The July FOMC meeting was very, very similar to the April meeting in which the Federal Reserve posed a ‘less dovish’ statement to markets. And initially, in both cases, markets weren’t listening as the U.S. Dollar continued to sell-off on the expectation that the Fed would stay loose and passive despite their hawkish claims. But in both scenarios, persistent ‘Fedspeak’ eventually prodded the Dollar higher as markets began to listen to the persistent warnings from the Fed. In this most recent iteration, the driver has been Fedspeak emanating from the Jackson Hole Economic Symposium, and as of now, the U.S. Dollar is continuing to move higher as Federal Reserve commentary continues to prod near-term rate expectations higher.
On the chart below, we look at the rollercoaster in the U.S. Dollar this year as driven by expectations around Federal Reserve rate hike policy.
Created with Marketscope/Trading Station II; prepared by James Stanley
Does this mean that the Fed will hike in September?
No. While the ‘case may be strengthening’ for a rate hike, this has been a strategy of the bank for the past year-plus in an apparent attempt to stem the risk of ‘bubbles’ building in asset markets as driven by continuously loose monetary policy from Global Central Banks. Because when the Fed tells markets that they’re going to stay loose and passive, this exacerbates the problems being seen of extremely low yields in debt markets and even larger valuations of equity prices. Investors have little choice other than to chase equity returns, as long-term debt investments are downright threatening with the prospect of ‘normalization’ on the horizon.
So, despite the rampant strength being seen in the U.S. Dollar after Fridays speeches from Janet Yellen and Stanley Fischer, don’t be surprised if those rate-hike expectations come crashing down in the event of a bad data print, such as Non-Farm Payrolls later in the week. So despite the Fed’s hawkish claims of the past, they’ve shown a continual pattern of relenting in the face of market sell-offs. So, this may not be the best time to load-up on stocks, at least until the Fed reverses their stance towards near-term rate hikes again.
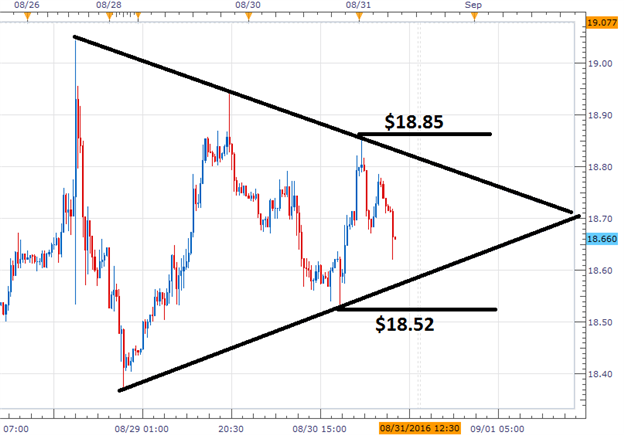
For those that do want to trade on the theme of a continuation of strength in the Greenback, the USD/JPY may continue to be one of the more attractive venues to voice that theme. If we do, in fact, get a continuation of hawkish Fed commentary, and if data comes in strong enough not to derail those plans as we move towards the September FOMC decision, the divergence between FOMC and BoJ expectations could continue to climb.
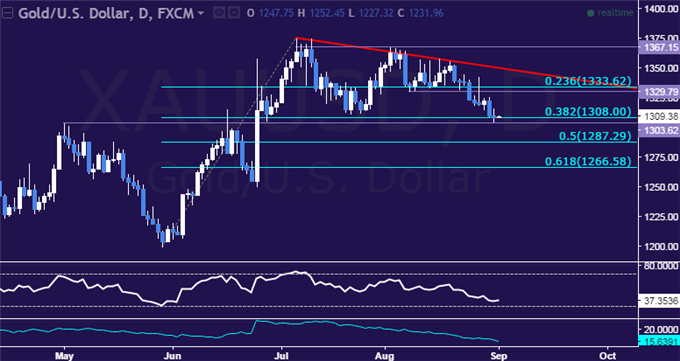
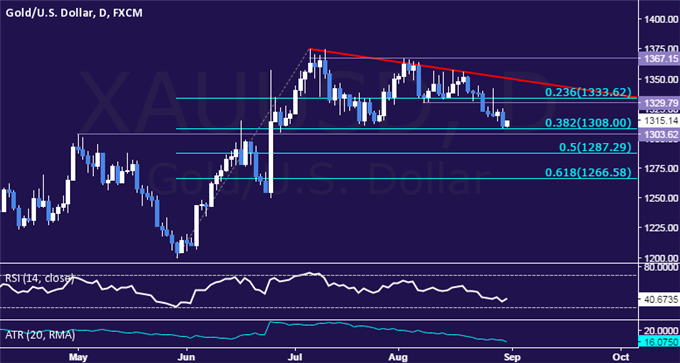
And for those that do want to look for a reversal of this USD strength with the expectation that the Fed will eventually relent from rate hike plans, watch Gold prices as USD weakness driven by dovish expectations for the Federal Reserve could continue the +20% run that Gold prices have been on this year.
We discussed both setups in the article, Gold, Yen Primed for USD Volatility around Jackson Hole, and if you’d like a video-based discussion of the same themes, please check out our archived webinar from later on that day.
--- Written by James Stanley, Analyst for DailyFX.com
To receive James Stanley’s analysis directly via email, please SIGN UP HERE
Contact and follow James on Twitter: @JStanleyFX
Fedspeak Drives Dollar Higher, but Will FOMC Actually Hike in 2016?Fedspeak Drives Dollar Higher, but Will FOMC Actually Hike in 2016?
https://rss.dailyfx.com/feeds/forex_market_news


.jpg) PBOC to extend use of SDRs
PBOC to extend use of SDRs


 Oh, hai!